
Derating Curves, Power Ratings, Maximum Current Ratings
 Written by
Wendy Jane
Preston
Written by
Wendy Jane
Preston
Current and operating temperature are closely linked within an electronic component, and we’re going to help you to understand the basics in this relationship. We recommend you read our blog post The Secrets of Temperature Ranges first, to make sure you understand what we mean by Operating Temperature.
Download this article in PDF format
What is a Derating Curve?
A Derating curve is a graph that shows how the maximum current rating of a component decreases as the ambient temperature increases. It can also be called a power rating curve or a current carrying capacity curve or graph.
When you have a derating curve for a mated pair of connectors, you can then establish the maximum current for any temperature where the connection operates.
Let’s start with the test method to get the data needed that fills this graph.
Testing Method for Temperature Readings
To be able to plot current/derating curves, we first need to have data for the temperature rise resulting from a level of current.
Current passing through the metal contacts causes the molecules to have more energy – the higher the current, the more energy. A side effect of this is to release some of that energy as heat.
Now, if you’re manufacturing a heating element, this is a desirable side-effect. In electronics, generally not so welcome.
Depending on your method of choice, some of these steps may vary slightly, and there are a variety of standards across the globe. Our method is based on EIA-364-70A.
- Step 1: Thermocouple attachment
To test for this effect in a laboratory, we wire a thermocouple to the connector or contact. This gives us a temperature reading at the worst case – right next to the part causing the heating.
In the case of our latest power connector, the Kona range, we drilled into the housings to get nearer the contacts – just to make sure we got the absolute worst case temperature rises measured.
- Step 2: Set the Baseline
To make sure that we’re only measuring the effect of the current, we need to know the ambient temperature of the connector and the room. Not only is this measured at the start of the test, but the room ambient is also measured every time a temperature rise is measured – to allow for the whole room changing temperature and affecting the results.
- Step 3: Ramp up the Current
Here’s where we start the actual testing process. The current is switched on and set at the first step level. What that level is depends on the product you’re measuring! If you’re testing a power connector, you might do steps of 2, 5 or even 10 Amps.
If you think the maximum is only going to be 0.5A signal, then your steps are 50 or 100 milliamps. Whatever the level, it should be DC continuous current, not pulsed.
- Step 4: WAIT, then Read
It takes time for the metal to heat up – it’s not going to jump immediately to its highest temperature. Give the experiment time to heat and settle. Then note the new temperature of the contact – and the ambient temperature in the room again.
This “dwell” time (allowing the raised temperature to stabilize) will be longer for higher currents – some of the periods during the testing of Kona were up to 30 minutes!
- Step 5: Raise and Repeat
Raise the current level to the next step, allow the temperature to stabilize, take the readings. Keep going until you pass the upper limit of your operating temperature – if you stop before this, you might be underestimating your product’s capabilities! For Kona, this meant we tested all the way up to 100A.
Now you have two sets of temperature readings for each current level. Subtract the ambient temperature from the contact temperature, and you have your temperature rise for that current level. Of course, you’ll want to do this experiment on more than one mated pair and get some average readings, to get a more reliable data set.
Graph 1 – Temperature Rise v Current
This is as simple as it sounds – plot the data from your testing, Temperature on the Y axis and Current on the X axis. Here’s an example from our Kona testing:

As expected, the 4-contact connector generated the most heat. For more detail on the specifics of the Kona test, check out Test Report HT076.
From this graph, we can now find the expected temperature rise for any connector size at any level of current.
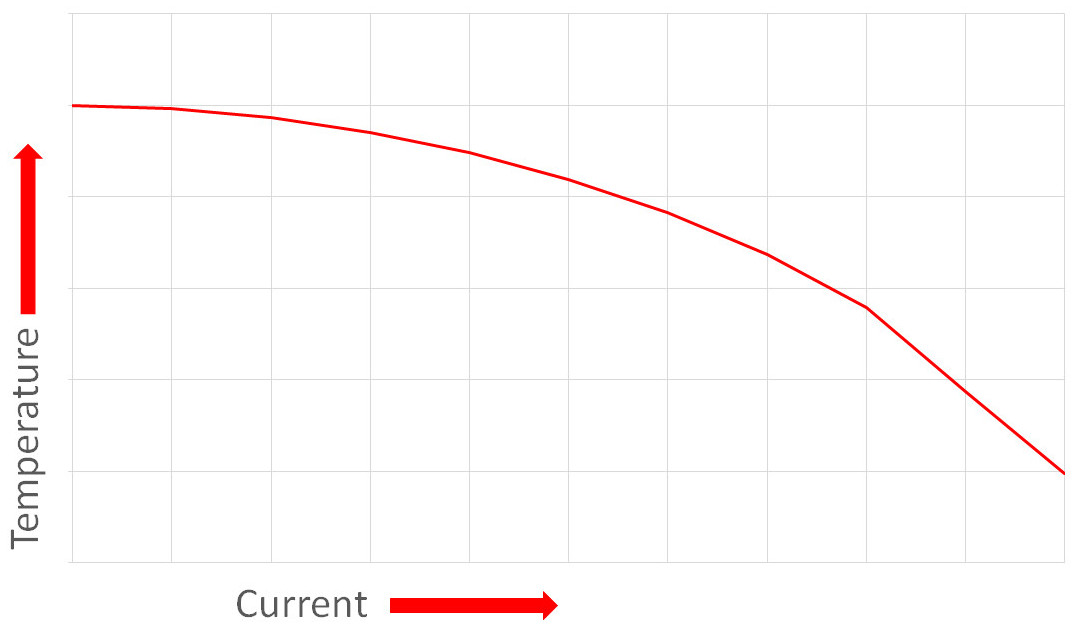
Graph 2 – Derating Curve
To generate the second graph, we need another bit of math on the temperatures. Take the maximum operating temperature and subtract your temperature rise reading. This will give you the maximum ambient temperature for each of your current levels.
For instance, see this sample data:
| Current Reading | Temperature rise | Max. Operating Temp. | Max. Ambient Temp. |
| 1A | +10°C | +100°C | +90°C |
| 2A | +20°C | +100°C | +80°C |
| 3A | +30°C | +100°C | +70°C |
Put the Max Ambient Temp on the Y axis, and the Current on the X axis. Here’s the Kona example again:

At 80A, the 4-contact Kona exceed the maximum operating temperature of 150°C, which is why you see this graph dip into negative temperature readings.
This graph is now showing you the safe operating range of temperatures and current for any size of the connector. Any combination of temperature and current below each curve is likely to be acceptable.
For instance, if your equipment experiences internal temperatures up to 90°C, you can use Kona 4-contact with up to 52A of current through every contact – in theory. In practice, consider adding a safety margin – see more about this later.
Max Current Rating
After all this testing has been carried out, a nominal value for the current rating is determined. Now there are differences in the accepted method of determining a maximum current value for a connector or contact.
Some will be calculated from a 30°C temperature rise, or a 45°C temperature rise. Others may be determined by looking at the graph and determining a reasonable value, considering the expected end applications.
Kona falls into this category – 60A max per contact does give a healthy temperature rise. But this still shows a maximum ambient well below the maximum operating temperature of 150°C, comfortably higher than typical environmental ambient temperatures of -20°C to +50°C.
In the Real World
Remember, these graphs were established in a laboratory, under ideal conditions, stable power supplies, etc. In real-world situations, it’s best to add in a safety margin to allow for additional variations in conditions and unforeseen circumstances.
If there are many variables which could impact on the performance in the end application, serious consideration should be given to carrying out your own testing. Consider building prototypes that can more closely represent the final usage methods, or climate testing in experimental chambers.
Alternatively, your equipment may have additional cooling functions – heatsinks, fans or other methods – which removes heat from the contacts, and may allow you to reach higher current values. Testing is again advised when you employ these techniques.

Laboratory conditions for connector measurement and test
Continuous v Pulse Current
One question that comes up is how our derating curves and current rating will predict if a connector can handle a higher current over a shorter time. The short answer is that they don’t.
Remember, the testing is done by letting a continuous stable current pass through the connector and let it heat up the metal over time. This does not give any indication how it will handle a higher current for 5 seconds or milliseconds.
As with all specifications on any product, the only way to establish performance criteria outside the manufacturer’s information is to do the testing yourself, sorry! You could choose to either test as an isolated part, in a small PCB or module, or within the complete application. Depending on the application and layout involved, each may yield different results.
Summary
Establishing derating curves is a relatively straightforward procedure, although it does take some time and good equipment to ensure the results are dependable. If your application is in the upper third of the product’s temperature range, or near the current limit, it might be worth investing in your own testing that is more application-specific, even when the manufacturer supplies laboratory derating curve data.
How can we help you?
If you would like to talk to someone about Harwin’s product, technical knowledge or documentation, contact one of our Experts for assistance.
More articles for you

The Secrets of Temperature Ranges
14 June 2021
New 60A Rated 8.5mm Pitch Power Connector from Harwin
18 November 2020
Harwin Introduces Robust Larger Diameter Terminal Pins
15 December 2020Uh oh, it looks like you are using an outdated browser version.
Some functions may not work as expected on Harwin.com in your current browser. For the best experience, more security and speed, we recommend updating your browser to the latest version.
(if you are using Internet Explorer, we recommend switching to an alternative browser.)
Still having issue? Contact [email protected] for help.